
On the 15th of April, Eurostat, the statistical office of the European Union, invited journalists from all over Europe to a Data Journalism Workshop to improve the transparency and accountability of data. I had the honour of attending the event to improve the Jobboard Finder statistical and data related research. Here is a brief overview of the event.
A multicultural event
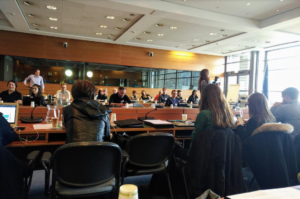 The 35 journalists attending the event were from 18 different countries across Europe, including Estonia, The Czech Republic, Romania, Slovenia and Hungary as well as some bigger players like Germany, France and the United Kingdom. If you take into consideration the Eurostat Team and the origins of some of the attendees, there were easily another handful countries present. The keynote speaker, Dr.Bahareh Heravi, came from Ireland; Baiba Grandovska, the Press Office and Social Media Team Leader, comes from Latvia; I, myself come from Australia and the Spanish journalist next to me came from Brazil. The other hosts were Tim Allen, the Acting Head of Unit: Dissemination and User Support, Romina Brondino, from the Press Office, and Mariana Kotzeva, the Director General of Eurostat.
The Eurostat headquarters are located in the heart of Europe, in Luxembourg, making it the perfect place for a melting pot of culture and interests. The participants in the workshop were not only focused on different countries, but on different data, which is why Eurostat invited us all to discuss improving data collection, data research and data sharing.
A focus on understanding data
 Throughout the half-day event, Eurostat emphasised the importance of a sustainable partnership between statistical bureaux like theirs and those who actually transform the data into stories for the public. For such a partnership to work, both parties need to gain a better understanding of one another, which is why the workshop opened with a presentation on Data Journalism from Dr. Bahareh Heravi.
Dr.Heravi is a Data Journalism Researcher from Dublin with a background in Software Engineering. Her presentation on “The Story behind Data” addressed the impact our usage of data can have on a nation and on the world.
As it stands, there is 2.5 quintillion bytes of data generated and 90% of it comes from the last 2 years. This means that data production and collection are growing at an expediential rate, which has both positive and negative effects. The good news is that more data means potentially more understanding of changes in the world and of ourselves. The bad news is that the amount of data is so overwhelming that it can be difficult to sort through and to draw relevant conclusions from what we know. This is hard for professionals and near impossible to ordinary citizens, so they rely heavily on how data journalists research topics and present their findings.
To ensure everyone can access the power of data, Dr.Heravi recommended focusing on Low Tech Data Journalism (instead of Big Data). This enables journalists to share more data more regularly and to arouse the curiosity of the public. If more people show an interest in data, more funds can be invested in researching the longer projects.
The Eurostat website
In theory, producing content regularly is a great. However, it can be challenging for a journalist to find enough interesting topics to guaranty a constant number of views on their media. As a company with a biweekly blog, we know firsthand how difficult it can be to produce content while researching complex topics, which take time to complete. Ideas can be hard to come by so that’s where the Eurostat website comes in. The top of the homepage highlights the New Releases section, providing journalists with topics, graphs and current statistical information.
In addition to the handful of featured statistics a month, Eurostat also has a page of links to European national statistical bureaux. If you are working on a specific topic, you can also visit the quick links for figures on a specific topic or country. Dr.Heravi showed us how to download graphs directly from the site and how to customise them for our specific needs. Most of us watched the presentation in amazement since we weren’t aware of the handy tools Eurostat had to offer.
To avoid confusion, Tim Allen also explains what Eurostat does not do:
- Economic and political comments
- Public opinion surveys
- Economic forecasts
- Business/consumer confidence reports
- EU budget figures
- Tax rates
He explained the 15(1/2) principles of the European statistics code of practice, which you can find on the Eurostat website. These include independence, relevance, punctuality and accuracy. As data journalists, the participants in the room strive to maintain the same principles.
Feedback from the participants
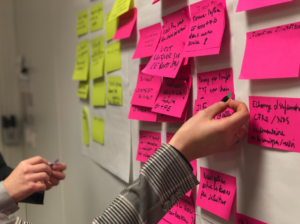
Even if we can all agree that Eurostat does a fantastic job at providing data on Europe to its users, there is room for improvement. Eurostat knows that and invited us all in the hopes of doing just that: improving the website, the content and the access. In the second part of the event, the 35 participants were split into 6 groups to brainstorm on how Eurostat can serve its users and what content we would like to see. After 30 minutes, we changed groups, leaving one person in front of the drawing board to present the ideas to a new team of journalists. Then, the brainstorming started again. At the end of the two sessions, one person from each team presented the feedback to the room. Here are the suggestions.
Website design
 Every team mentioned the website design so it makes sense to start with this subject. For some, the search engine wasn’t user-friendly, for others the tree of topics forces users to know where to look for information. Whatever the complaint, the solution remained: UX design needs to be a priority. One team suggested different portals (for citizens, for journalists and for statistical bureaux) to adapt the degree of information to the user. Another group suggested a more intuitive search engine, which highlights were the keywords are in the tree of topics (to teach users to use the Eurostat tools). Other noteworthy suggestions for the website were modelling the search engine on the World Bank, indicating if the data from one country is not comparable to another country through colour indicators and providing a link in the footer to the methodology of data collection.
Content
When it comes to content, Eurostat is limited to the available data from the national statistical offices. That said, some topics could be (and are) being added to the database. One of them is job vacancies across Europe so it is of particular interest to us. We do have our own sources of job vacancy data thanks to job boards though. For Jobboard Finder, the most useful data would be on the number of graduating Europeans in a specific field (X number of engineers obtained a Master’s degree in X year in X country, for example). This information would have to come from the universities and an equivalence system for certain courses would be necessary too. However, if this information were available, it would be a goldmine for international recruiters sourcing for difficult positions. Knowing the potential passive and active candidates goes beyond the knowledge of a job board. Another interesting topic for our team is financial and state benefits across countries. In order to actually understand buying power, these factors are incredibly important. France often comes in relatively low when comparing the buying power in European countries. However, the financial aids are particularly high. This, however, may not be data Eurostat can collect.
A number of journalists wanted more information on cancer or other illnesses, but privacy issues were a current roadblock. In certain Romanian regions, the low population density made it impossible to provide data on certain topics because it revealed private information about the few locals living there. The same problem was cited by one of the Slovenian journalist. He also wanted more regional statistics because it wasn’t possible to compare data on big cities to the more regional landscapes of Slovenia.
Even when journalists could find the figures, some doubted the accuracy. As locals in their home countries, the official data doesn’t always match the actual state of affairs. The Romanian investigative journalist questioned the fact checking on a number of topics and urged Eurostat to dig deeper than the official numbers.
A Polish journalist raised the question of release dates. As journalists writing for the general publish, it’s difficult to explain why the statistics are two or even five years old. Eurostat is aware of the problem and strives to produce the data as quickly as possible but it does force journalists to make choices: to publish or not to publish? To compare to other nations or to publish national figures only?
Conclusion
The initiative from Eurostat to share data has already changed the face of Europe. Now, the efforts to improve the website and content, to provide more tutorials and webinars and to create sustainable partnerships with journalists through workshops and a network platform are quite outstanding. With transparency and more accountability, we charge towards a bright future for generations to come, so thank you Eurostat.
Author: Ali Neill
As the job board tester and blog editor for the Jobboard Finder, Ali works on job boards from all around the world and keeps a close eye on the recruitment trends thanks to a number of sources, including the website’s social media pages.

« Where and When to Use LinkedIn
Interview with Shane McGourty from AdView »
looking for work in kelowna and west kelowna